
March 3, 2026


A distributor can post strong sales and still lose margin in places that receive little attention. A small pricing exception here, an unnecessary shipment there, or slow-moving inventory sitting in a warehouse may seem insignificant on its own.
Across thousands of orders and customer accounts, those losses add up. Creating a profit leak map helps distributors identify where revenue is being consumed.

Pricing is one of the clearest places to start. Distributors frequently negotiate customer-specific rates, volume discounts, rebates, and special terms. Problems arise when exceptions remain in place after the conditions that justified them have changed.
A customer may still receive pricing based on purchase volumes it no longer reaches. Another account might receive several discounts that were created independently and were never evaluated together.
Reviewing gross margin at the customer, product, and order levels can expose these patterns. Profitability software can help connect transaction data with costs so managers can see which sales contribute meaningful margin and which appear more valuable based on revenue alone.
Inventory ties up working capital from the moment it enters the warehouse. Products that move slowly create additional costs because they occupy space and may eventually require markdowns, transfers, or disposal.
The problem becomes harder to see when purchasing decisions are based heavily on historical volume. A product that sold well two years ago may still be reordered even though current demand has weakened.
Inventory turnover should therefore be examined at the SKU level. Distributors can compare purchasing patterns with current sales velocity and identify items that routinely remain in stock longer than expected. This provides better information for future purchasing decisions.
Two orders with identical revenue can produce very different margins. One might ship as a full case from a nearby warehouse. The other may require individual picking, special packaging, multiple shipments, and expedited transportation.
These differences are easy to miss when fulfillment expenses are treated as general overhead. Looking at cost-to-serve data can show which ordering patterns repeatedly create extra work.
Small orders deserve particular attention. A low-dollar order may require nearly the same administrative and warehouse effort as a larger transaction. Minimum-order policies or appropriate handling charges can help address cases where processing costs regularly consume the available margin.
Returns can create several layers of expense. The distributor may pay for transportation, inspection, repackaging, restocking, and customer service before the product can be sold again.
Patterns matter more than individual returns. If one SKU produces unusually high return rates, it may require investigation. If a particular customer frequently returns correctly supplied products, account terms may need review.
Profit leaks are rarely confined to one department. Pricing decisions affect sales margins, purchasing affects inventory costs, and fulfillment choices determine how much of that margin survives delivery. Mapping these losses across the full transaction gives distributors a clearer view of where earnings disappear. Check out the infographic below to learn more.
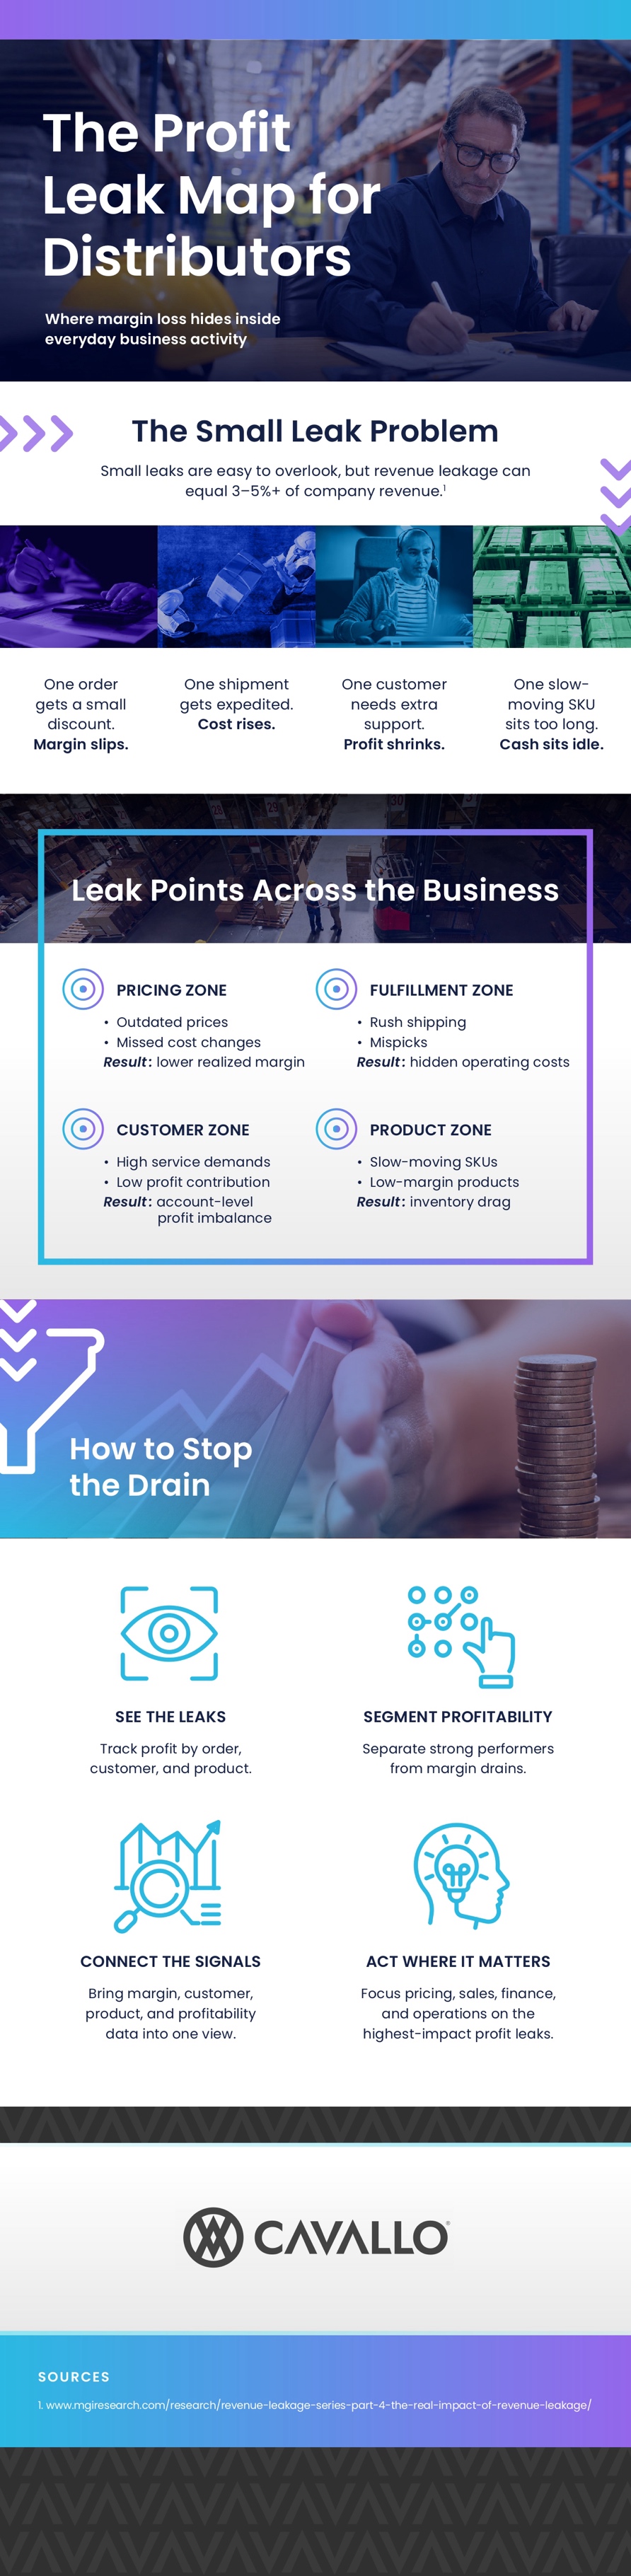
It is a view of where margin disappears across the whole transaction rather than in one department. It connects pricing decisions, inventory costs, fulfillment effort and returns so the losses become visible together.
Because they rarely get revisited. A discount granted for a volume commitment stays in place long after the customer stops hitting that volume, and separately negotiated discounts are seldom reviewed as a combined position.
At SKU level, comparing purchasing patterns against current sales velocity. Buying on historical volume keeps slow movers cycling through the warehouse, tying up capital and space until they need marking down.
Cost to serve. A full case shipped from a nearby warehouse costs far less to fulfill than an order needing individual picking, special packaging, multiple shipments and expedited transport.
Patterns rather than one-offs. A single SKU with an unusually high return rate suggests a product or description problem, while a customer repeatedly returning correctly supplied goods suggests the account terms need review.